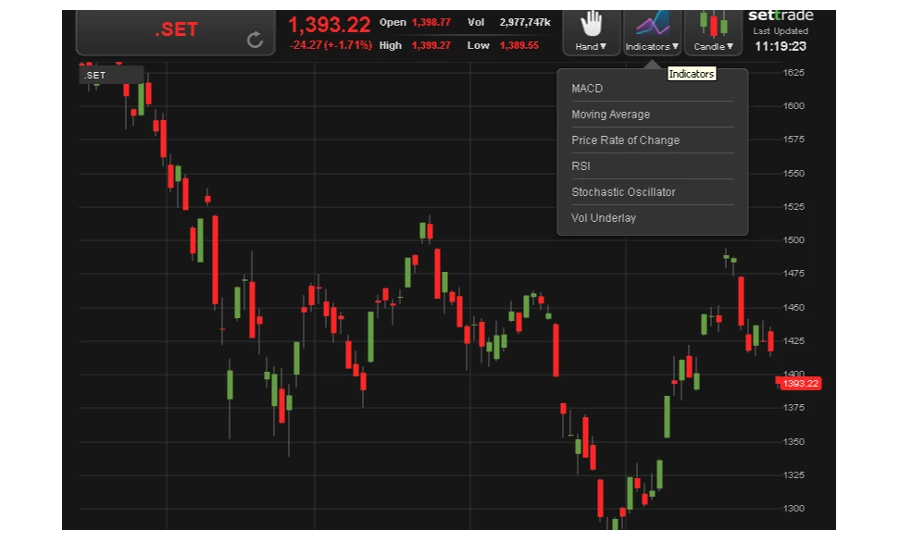
Streaming HTML5 Technical Chart for PC is now ready for use! This latest function provides you with real-time technical graphs on equity and derivatives together with MACD, Moving Average, Price Rate of Change Indicators and others including analysis and real-time news. Special for RHB Securities customers!.
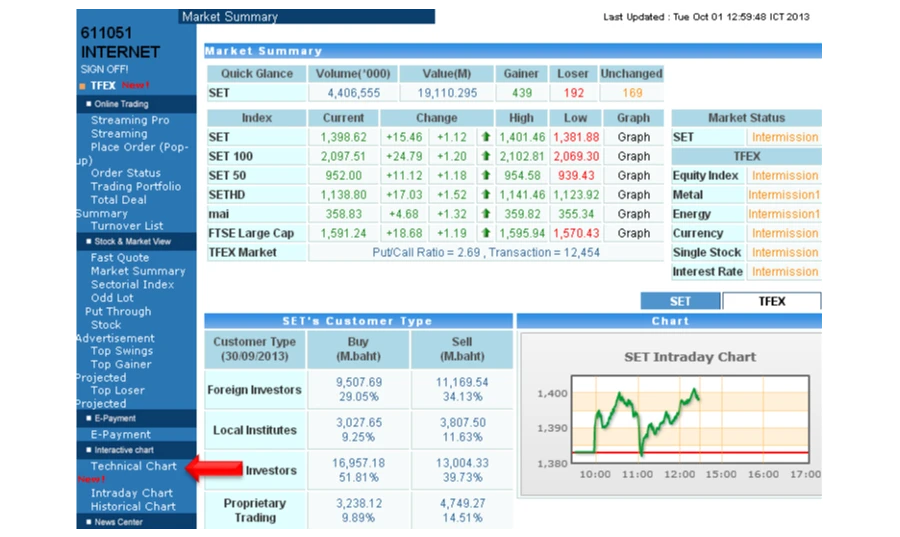
2. View menus on your left, then click Technical Chart in Technical Chart Item.
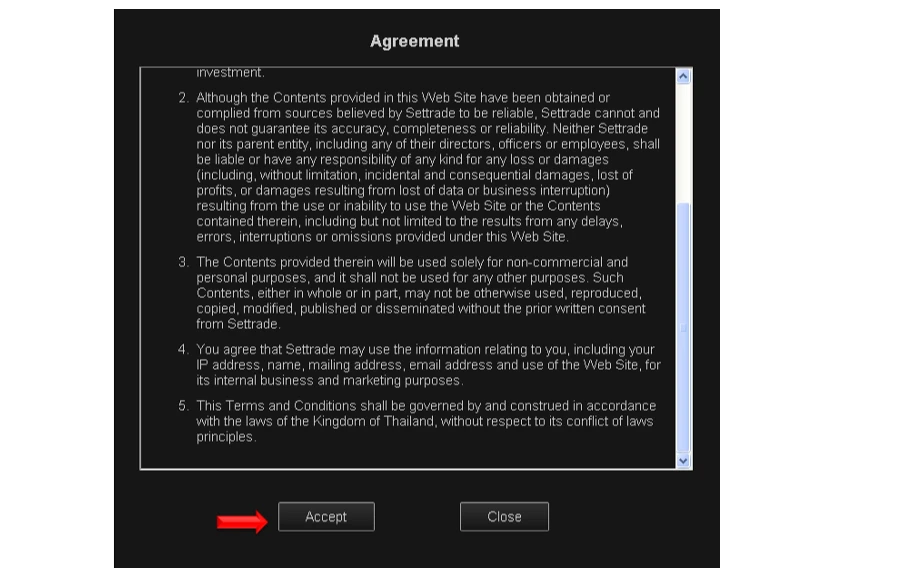
3. For first-time use, Agreement Window will appear. Click Accept.